Interpreting the Covid-19 Trajectory chart
This chart is to show the growth rate of COVID-19 on a scale that that makes seeing if it is spreading at an exponential rate, or if the curve has begun to "flatten". It is important to note that it is on a Logarithmic scale, and also that the "Y-axis" is the total cases in the last 7 days, meaning it will be more conservative in showing trends. More explaination on this chart type can be found in the resources footer below.
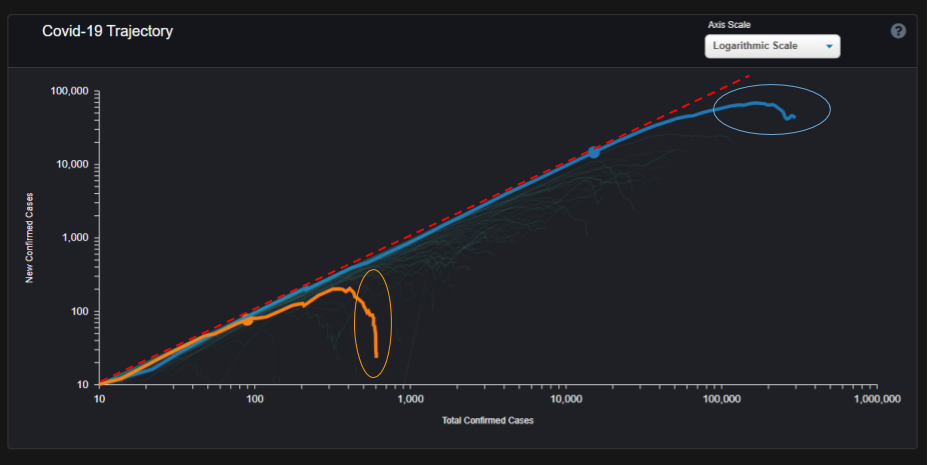
- Exponential growth line: This dotted line gives where there is exponential growth of number of cases. The more vertical the state's curve is progressing down to zero the more they have contained the spread
- In the highlighted blue section you can see an example of a state who's growth rate is still pretty similar to the exponential growth curve, meaning cases are still growing rapidly
- In the highlighted orange section you can see an example of a state who's curve is almost veritcal, meaning they have signficantly slowed the growth rate and have done a good job "flattening the curve"
- The Circles make where each state issued a stay a lockdown order, and the squares mark where that state has issued a reopening order
Inspiration of this visulization from https://aatishb.com/covidtrends/ and MinutePhysics
Interpreting the Severity Scatter Plot
This chart allows you to compare the relative severity of each state when a lockdown order occured in that state. It gives sorting criteria to allow you to look at the data grouped in different ways, and with different factors to determine the severity in each state.
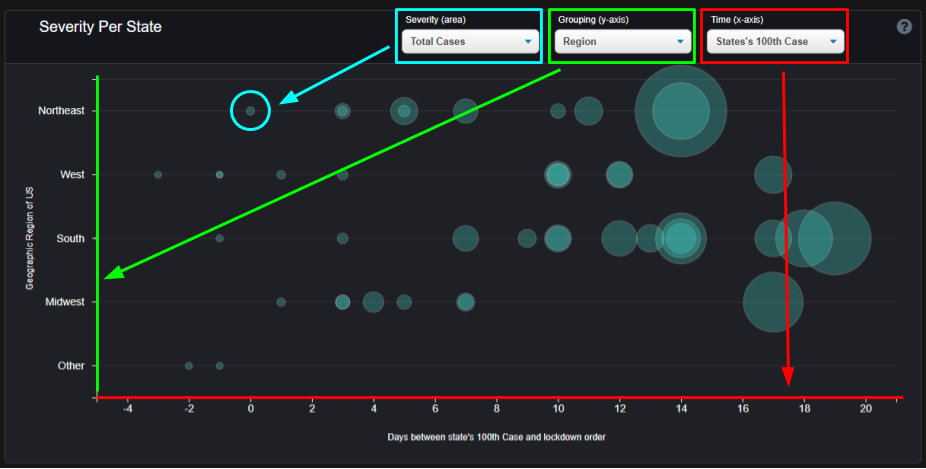
- The X-axis : in thie chart represents number of days since an event for each state until that state issued its' lockdown order. The default is each individual state's 100th case. Note a negative value of days means the order was issued before the 100th case for that state. The further right a circle is the longer it took them to respond and issue a lockdown order.
- The Y-axis in this chart gives a grouping criteria for the states. The default is grouped by region, so that all states in that given region are at the same y-height
- The Area of each individual state is given by how "severe" it was in that state at the point of the lockdown order being issued. Larger circles correspond to more severe
Interpreting the State-Issued Orders Chart
This chart is to show the state ordered actions taken by the local government, sorted by which type of order it is and dates it was released on
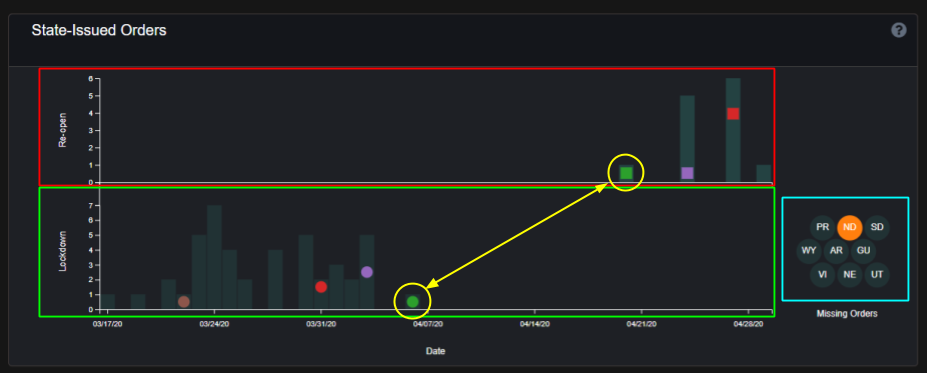
The fainter rectangles in the chart are the number of that type of order given on each day. If a state has both a lockdown and reopening order they will be displayed in each with the same color
The Lower half of the chart shows the lockdown orders per date, and when a state is selected it will appear with a circle in the date it issued an order. These also correspond with the circles in the Covid-19 Trajectory chart
The Upper half of the chart shows the reopening orders per date, and when a state is selected it will appear with a square in the date it issued an order. These also correspond with the squares in the Covid-19 Trajectory chart
The Right hand side shows states which are missing orders for each order type
Interpreting States Ranking Chart
This chart is to show the absolute and relative values of states ranked on different criteria. More criteria on selecting the ranking criteria to come.
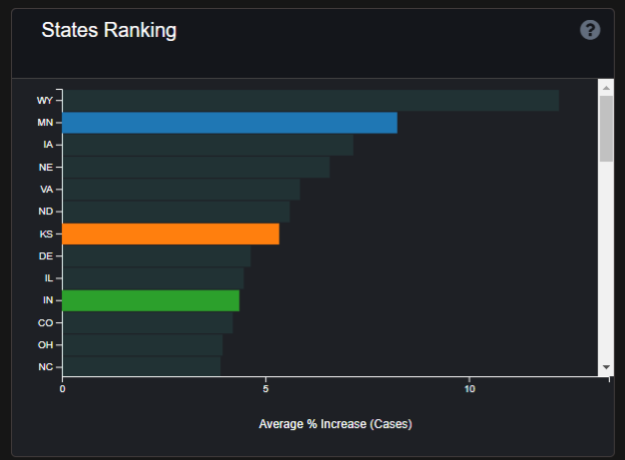
The default is the Average % Increase of Cases for each day, averaged over the previous 3 days. This shows you how quickly cases are speeding up or slowing down, compard to the number of cases there already are.
State Selection
This section is used to be a selection tool for exploring the visulization
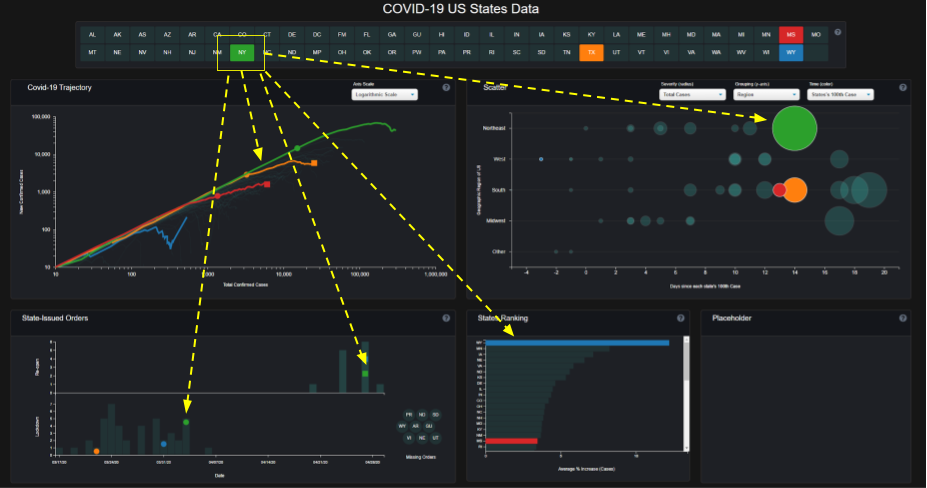
Selecting any of the states will highlight and bring to focus all the data points corresponding to that state in every chart. Some states are not represented in every chart, depending on if there is data for that state for that chart type. You can also select any state by clicking on the data element in each individual chart